

You run a website speed test, it hands you a shiny A-grade score up in the 90s, and you figure your site is… fast. Then you pull up that same page on your phone in line for coffee and sit there watching a blank screen load for 3 full seconds. So which one is actually telling the truth?
Here’s the catch: most free speed scores run under perfect lab conditions, nothing like what your readers deal with every day. A slower phone, a weak signal, or a visitor halfway across the world can quietly push your real page load time past the point where people give up and leave.
That blank screen is a performance problem, and closing the gap to a seamless user experience is exactly what this walkthrough is about.
Key Takeaways From Your Website Speed Test
Your speed score is useful, but it isn’t the finish line. The number can tell you that something is off, while a detailed test shows you exactly which file is making visitors wait.
- Test from conditions that match your real audience: locations, devices, and connection speeds, not just a fast desktop browser.
- Let page details point you first. The breakdown shows whether images, scripts, fonts, or CSS make up most of your total load.
- Read the waterfall chart to find the individual HTTP requests that start late or run long.
- Fix the heaviest assets first to improve your First Contentful Paint. Compress oversized images, convert them to WebP, and swap third-party requests like Gravatar for optimized local files.
- Retest and monitor after every meaningful change, so a plugin, theme update, or new image can’t quietly slow you back down.
Stop Guessing What’s Slowing Your Site with GTmetrix
I’ve run my sites through a lot of speed tools over the years, and this is the one that stuck. It tests from real devices and locations, so what I see is what my readers actually feel. If you manage more than one site, it pays for itself fast. To make that easier, use code Ryan20 for 20% off your first year 👇
Why a Good Speed Score Can Still Mean a Slow Site
A high performance score can feel like permission to stop thinking about speed. You ran the test, your grade looks great, and there are no red warning lights. Time to move on, right?
Not quite.
The score is only one data point. What matters more is how long a real visitor waits before they can see and use your page. If your hero image takes too long to appear, your navigation loads late, or your content sits behind a blank screen, that visitor isn’t grading your site. They’re deciding whether to leave.
For bloggers and business owners, that delay is expensive. You work hard to earn the click, but a slow page load time can destroy your efforts. Improving speed is vital because poor performance negatively impacts your SEO rankings and hurts your conversion rates. Don’t make people wait, as a poor user experience often leads to a higher bounce rate.
Lab Data vs. Real-World Conditions
Free site speed tools such as Google PageSpeed Insights are helpful for a quick gut check. But these tools rely on synthetic data or lab data, which means they’re produced under controlled conditions that may look nothing like your reader’s actual experience. Much of this diagnostic testing is powered by Google Lighthouse, which simulates a specific environment.
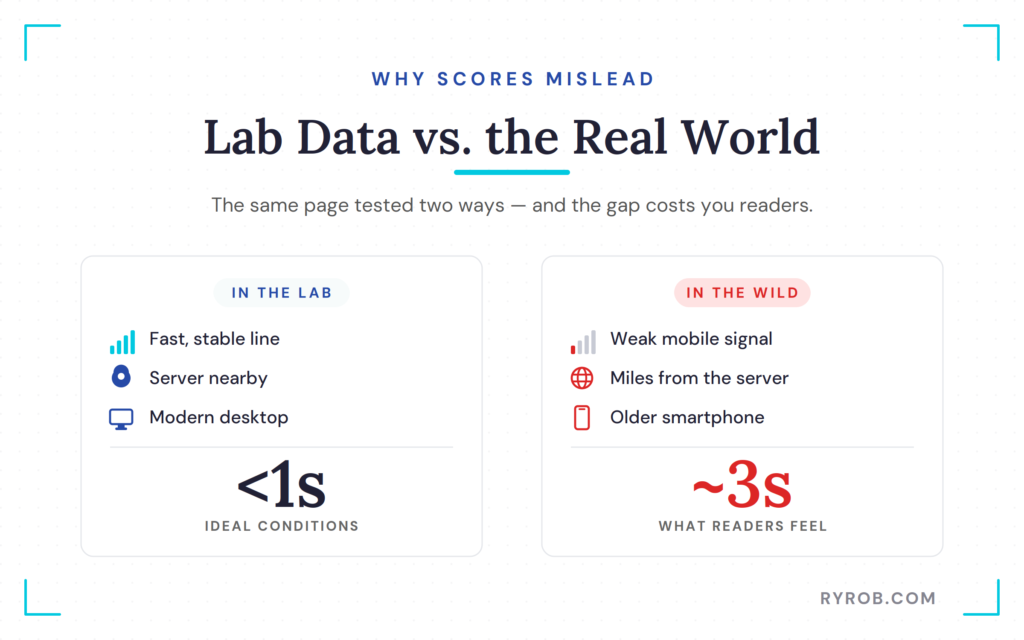
Think about the gap:
- The test may run on a fast connection.
- The test environment may be close to the server hosting your site.
- Your reader could be on an older smartphone with weak 4G.
- Your reader might be hundreds or thousands of miles from the test location.
That difference matters. A page that loads in well under a second under ideal conditions can take closer to three seconds for a visitor on mobile. If you’re working on a blog SEO strategy, remember that Core Web Vitals are the metrics that truly reflect real user data and the actual visitor experience. Great content can’t help much if readers leave before they see it.
Where Free Tools Like PageSpeed Insights Fall Short
Google PageSpeed Insights can flag issues with technical messages like “eliminate render-blocking resources” or “properly size images.” That’s a fine starting point.
The issue is that those suggestions often sound like they were written by a robot for another robot. Which image is too big? Which script is blocking the page? How much time is it costing you, and is it even the first thing you should fix?
A free score doesn’t always make those answers obvious.
GTmetrix gives you more context to work with. You can choose test conditions, review actual timing data, see the makeup of the page, and watch a visual recording of the page loading. Instead of getting a vague warning, you can trace the issue back to the exact asset causing it.
That distinction saves a lot of wasted time. You don’t need to rebuild your website just because one massive JPEG is holding up your above-the-fold content.
How to Run a Website Speed Test in GTmetrix
Start with a page that matters. Pick a popular blog post, a landing page, a product page, or the homepage. Don’t test some forgotten archive page and call it a day.
Then choose settings that match a meaningful segment of your audience. If many of your readers are in the US, test from a local server. If your analytics show that most visitors arrive on mobile, don’t only test a fast desktop browser. Using GTmetrix global locations is essential to ensure your data reflects the actual experience of your target audience.
The goal isn’t to find the most flattering score. The goal is to find the truth.
Watch Your Page Load Like a Real Visitor
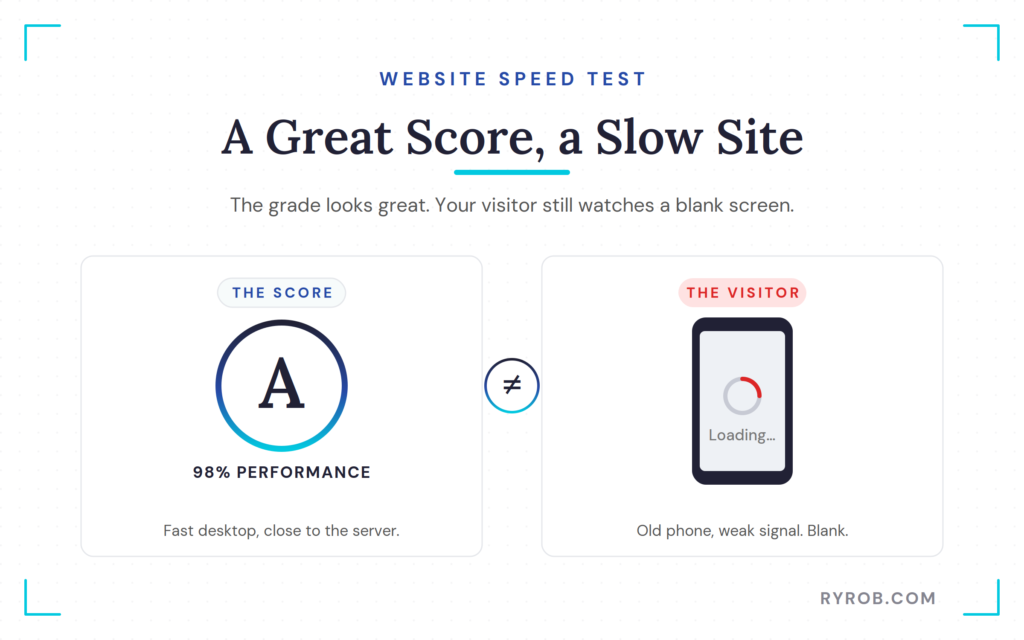
One of the most useful GTmetrix features is the page-load video. It records the loading experience so you can watch what a visitor sees, frame by frame.
This can be a little painful, in a helpful way.
On the page in the video, there was a long stretch where the hero image area stayed blank. That delay significantly impacts your Largest Contentful Paint, a critical metric for a healthy user experience.
The page wasn’t technically broken, but a person waiting for that image had no reason to believe it was ready, and that’s the kind of moment where people hit the back button.
A visual playback helps you spot problems a score can hide:
- Blank space above the fold
- A slow-loading featured image
- Content that shifts after the page appears, also known as Cumulative Layout Shift
- Navigation or fonts that arrive late
- A page that looks fine on desktop but drags on mobile
You don’t need to guess whether the page feels slow. You can see it.
Check Page Details for the Biggest Culprits
Before you dig into the waterfall chart, look at GTmetrix’s page details. This breakdown shows your total page size and how much of it comes from images, CSS, JavaScript, fonts, and other assets.
It’s a quick way to form a useful first hypothesis.
If images make up the biggest portion of the page, start with image optimization. If JavaScript is doing most of the damage, a huge hero image probably isn’t your main issue. The point is to follow the data rather than chasing every recommendation at once.
On the tested page, images were by far the largest chunk of the page. That didn’t solve the problem by itself, but it narrowed the search fast. Instead of digging through every CSS file and plugin request, the focus could stay on image assets first.
This is also why a well-built WordPress blog needs some basic housekeeping. Images, plugins, fonts, and third-party tools all add weight over time. A site can get slower one small decision at a time.
Read the Waterfall Chart Without the Headache
A waterfall report looks intimidating at first. There are rows of files, colored bars, and a lot of tiny timing details. Once you know what you’re looking at, though, it’s pretty straightforward.
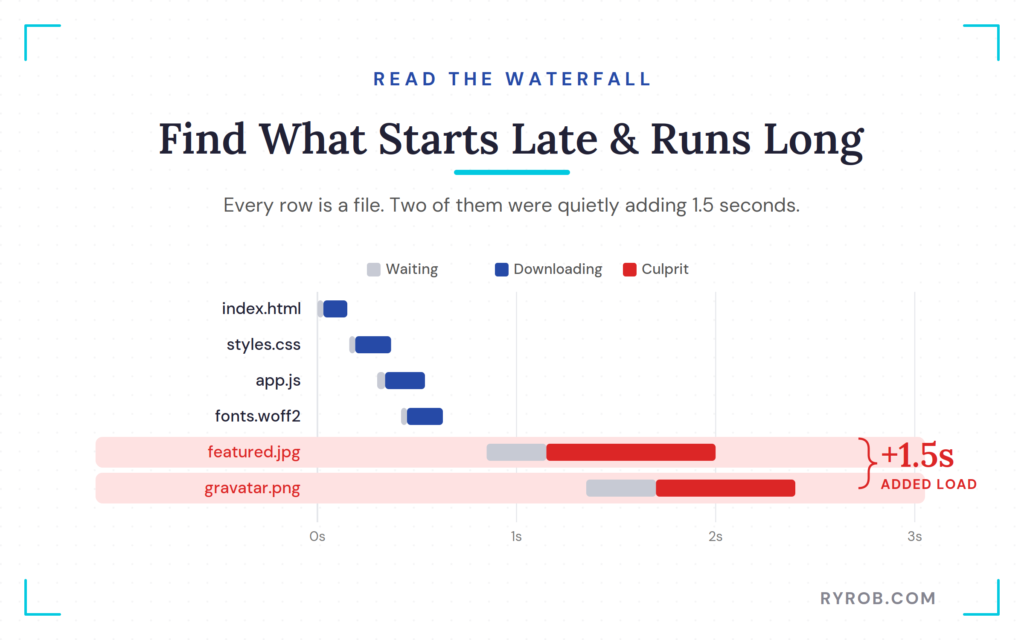
Every row is a file your browser has to request to load the page. These HTTP requests involve various resources, including HTML files, CSS files, JavaScript, fonts, images, or requests to third-party services.
The timeline runs from left to right. The gray part of a bar shows waiting time. The colored portion shows the file downloading.
Here’s the simple rule: look for files that start late and run long.
Those are often the files eating up your visitor’s time. These performance metrics are tied closely to Core Web Vitals, which Google uses to measure how your site performs.
In the example, the HTML loaded fine. The styles looked good. Fonts weren’t the issue. Two image requests stood out instead: a large featured image and a Gravatar profile image that appeared on every post.
Together, those requests added close to 1.5 seconds of page load time. That’s not a tiny technical detail. That’s the difference between a page feeling responsive and a page feeling stuck.
Don’t try to optimize everything in the report at once. Find the biggest obvious bottleneck, fix it, and run another test.
Steps on How to Speed Up Website Performance
If you’re looking for how to speed up website performance, you’ll often find the most effective solutions are surprisingly simple. The fixes in this case were almost boring, which is good news, because basic adjustments are usually the fastest to implement.
First, the oversized featured image was compressed and converted into the modern WebP format. Image optimization is a critical step in performance tuning, and while WebP can significantly reduce file sizes while keeping quality, you should always check the final result before publishing.
For many users, there are various WordPress plugins that can automate these image conversion tasks locally.
Then the image was swapped into the post. No site rebuild, no developer, and no complicated migration required.
The next issue was the external Gravatar request. A Gravatar image is convenient, but it acts as third-party code that requires the browser to reach out to another server to fetch the profile photo. Since it was loading on every post, that small request had a wider impact than it first appeared.
Turning off the Gravatar profile image and replacing it with an optimized image hosted locally removed that outside request. The browser could then load the photo directly from the site instead of waiting on another service.
GTmetrix also revealed a third issue hiding in plain sight: the logo file. It was 1,000 pixels wide, which is wildly oversized for a logo displayed in a header navigation menu.
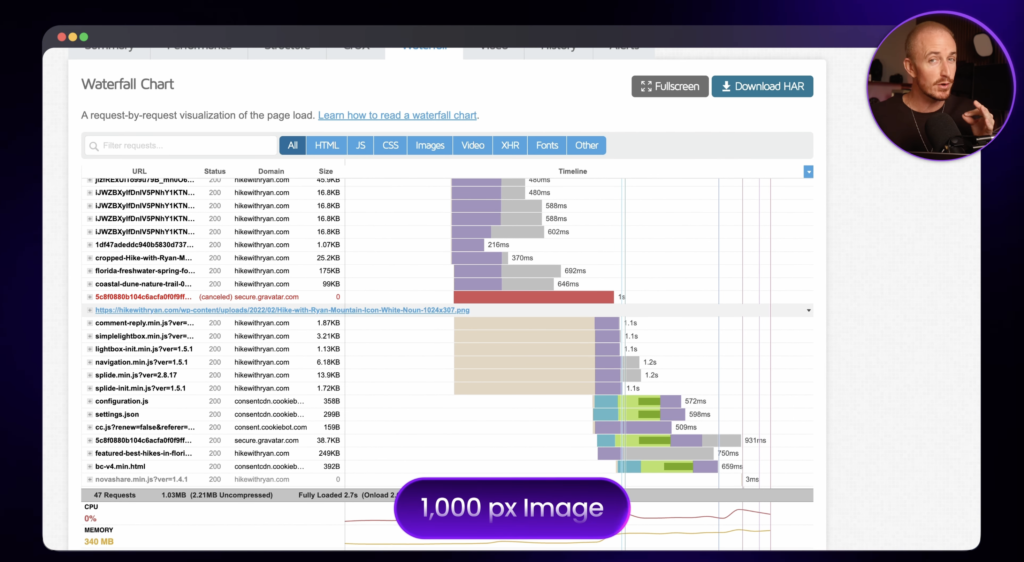
The fix followed the same basic process:
- Resize the image to the dimensions it actually needs and compress the file.
- Save it as a WebP format file.
- Upload the optimized version in WordPress.
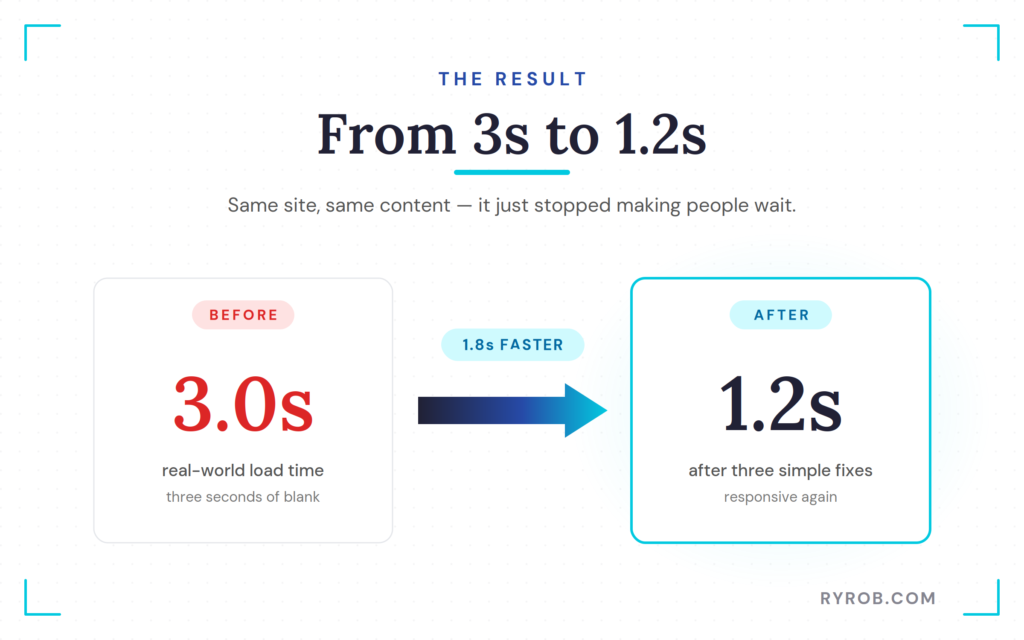
By resizing the logo and reducing the strain on the browser, the improved user experience was immediately apparent, as these adjustments significantly lowered the page load time. After those changes, the real-world load time dropped from about 3 seconds to 1.2 seconds. Same site, same post, same content. It just stopped making people wait around.
While these tools help, don’t treat them as a magic answer. A 1,000-pixel-wide WebP logo can still be much larger than a 400-pixel-wide WebP logo. File format matters, but image dimensions, compression, and the number of images on the page all play a vital role in your overall load speed.
How to Keep Your Site Fast Over Time
Website speed isn’t a one-and-done project. You can clean up a slow page today, then add a large image next month, install a plugin later, or change themes and accidentally bring the issue back.
The good news is you don’t need to obsess over it daily. You need a simple way to check the pages that bring in traffic, leads, and revenue.
Compare Devices and Locations
GTmetrix lets you compare the same URL across different settings. You can change the browser, test location, connection speed, and device profile.
This is especially useful when desktop performance looks solid but mobile performance is lagging. Testing different environments reveals how your site behaves under real-world conditions, which is where your visitors actually live. You can even use tools like WebPageTest to gain further insight into how your site renders on a specific mobile device.
A desktop browser on a strong connection can load a page much faster than an iPhone on mobile data. The side-by-side speed visualization and waterfall reports give you a clearer view of where that gap is coming from.
Mobile might be loading an image that’s too large. A script could be creating extra delay on that device. Distance between your visitor and your server may also be adding time. You won’t know until you test conditions that resemble the people you’re trying to reach.
If you write content with mobile readers in mind, your speed tests should reflect that. Your site doesn’t get bonus points because it loads fast on your laptop.
Set Up Monitoring and Alerts
Once you’ve improved an important page, consistent performance monitoring helps you keep it that way. By tracking your site from various global locations, you can gather real user data to understand how visitors in different regions experience your content. Inside GTmetrix, you can set up scheduled checks hourly, daily, weekly, or monthly.
The right interval depends on how often your site changes. A large ecommerce site may want frequent checks, while a smaller blog that publishes once a week may be fine with a weekly or monthly test. And if you notice consistent speed issues despite your optimization efforts, it may be time to evaluate whether your current web hosting plan gives your site the resources it actually needs.
You can also create alerts for conditions that matter to you. For example, if a GTmetrix grade falls below a threshold you’ve set, you can get an email and investigate before the issue sits there for weeks.
Monitoring is most useful on pages where slow performance has a real cost:
- Your homepage
- High-traffic blog posts
- Product or service pages
- Email campaign landing pages
- Pages that bring in affiliate or ad revenue
For content sites, traffic and income are closely connected. I’ve shared plenty of the good and bad in my blog income reports, and site performance is one of those less glamorous details that can affect the whole operation.
Let AI Read Your Reports for You
GTmetrix recently added an MCP connection, which lets you connect its reporting data with AI tools such as Claude or ChatGPT. MCP, short for Model Context Protocol, gives an AI assistant a way to access and work with connected tools. In this case, it can run GTmetrix tests and help interpret the report.
Instead of manually reading every row in a waterfall, you can ask for something like: “Analyze my latest report and give me the top three fixes in plain English.”
You can also ask the AI to test your site from two locations on an iPhone and compare the results. That kind of workflow is useful if you’re managing several websites or checking multiple important pages each month.
Full honesty: the MCP feature shown here requires a paid GTmetrix plan. It’s not a free magic button. But if you regularly run performance tests, it can cut down the time spent pulling reports and translating technical details into a clear to-do list.
FAQs About Running a Website Speed Test
Still have a few questions rattling around? Here are the ones I get asked most about testing a site and actually making it faster.
Is GTmetrix Better Than PageSpeed Insights?
Neither tool makes the other useless. PageSpeed Insights is a good free starting point and can surface useful issues quickly.
However, GTmetrix is more helpful when you need to investigate a specific performance score. While many site speed tools offer basic metrics, GTmetrix provides visual playback, specific test conditions, and page details that give you more to work with.
Why Is Mobile Slower Than Desktop?
Mobile visitors may have slower connections, older hardware, or higher network latency. Often, the server response time is also higher on a mobile device due to the way different assets are requested.
Because phones process data differently, testing only on a desktop browser can give you a false sense of security. If most of your audience reads on phones, you have to test on those platforms.
What Should Be Fixed First in a GTmetrix Report?
Start with the largest bottleneck that affects what visitors see first. You should use the waterfall report to identify which elements are negatively impacting your Core Web Vitals. An oversized hero image or a slow third-party script is often a better first fix than chasing tiny warnings.
Once you address heavy assets, look into common optimizations like lazy loading, which delays off-screen images, or defer JavaScript, which keeps scripts from blocking the initial render. You should also minify CSS and JavaScript to reduce file size.
Additionally, check your TTFB to ensure your server response time is optimized, which helps minimize latency, and implement Gzip compression to shrink data transfers.
Are WebP Images Enough to Speed Up a Site?
WebP is a useful format, but it won’t fix an image that’s far larger than the space where it’s displayed. You still need the right dimensions and proper compression.
Beyond image optimization, use a content delivery network to serve files closer to the user and enable browser caching so returning visitors load your site faster. Code minification and a content delivery network are both essential parts of a complete optimization strategy.
How Often Should Website Speed Be Tested?
Test after major site changes, new plugin installs, theme updates, or redesigns. For ongoing monitoring, weekly or monthly checks are a practical starting point for many sites.
If you notice persistent speed issues, it might be time to upgrade your web hosting plan. High-traffic pages deserve more attention than pages nobody visits, and it’s worth verifying your browser caching and lazy loading settings whenever you make major structural changes.
Can Beginners Use GTmetrix Without a Developer?
Yes. You don’t need to understand every line in a report to get value from it. Start with the visual load video and the longest requests.
Beginners can often handle image resizing, compression, and removing unnecessary external requests themselves, and modern tools make it easier to defer JavaScript or add lazy loading without deep technical knowledge.
Final Thoughts on Your Website Speed Test
That blank screen on a visitor’s phone isn’t going to care about your impressive speed grade. What truly matters is the actual page load time before your content appears.
Test an important page under realistic conditions to see exactly what your users experience. Watch the page-load video, check which assets consume the most bandwidth, and use the waterfall report to identify the slowest request. When you’re ready to learn how to improve your site performance, always fix the biggest bottleneck first and then retest your results.
By leveraging the waterfall report, you can turn vague speed advice into a clear, actionable plan to minimize your page load time and provide a better experience for every visitor.
Stop Guessing What’s Slowing Your Site with GTmetrix
I’ve run my sites through a lot of speed tools over the years, and this is the one that stuck. It tests from real devices and locations, so what I see is what my readers actually feel. If you manage more than one site, it pays for itself fast. To make that easier, use code Ryan20 for 20% off your first year 👇
Disclaimer: This story is auto-aggregated by a computer program and has not been created or edited by budgetbuddy.
Publisher: Source link
Publisher: Source link